
Why We Test Lenses Over Temperature: Model Validation, Focus Hysteresis, and Other Unusual Failure Modes
Date
October 4, 2021
Author
Kevin Sweeney
Time
5 min
Share this Post
Many applications require high quality imaging over a wide temperature range. This may be due to an uncontrolled environment (e.g. outdoor security cameras), or the intended environment may be regulated to something other than room temperature (e.g. body temperature for endoscopes). However with temperature variation comes thermal expansion, which introduces an opportunity for the flange focal length (FFL) of a lens to change. This shift defocuses the lens from the sensor plane, resulting in a blurry image. If the optomechanics are not designed to minimize this effect in use cases like those mentioned above, the drop in resolution (MTF) of the imaging system can be dramatic. In egregious cases, total mechanical failure (cracking) of lenses has been known to occur.
Ensuring performance over temperature starts in the lens design phase. Here, raytracing optimization must consider performance at various stages of thermal expansion, which drives decisions such as number of elements and glass types. After this, the mechanical designer of the lens assembly must continue to consider thermal expansion in choosing mounting materials and geometry, including clearances and tolerances. Even after a design is complete and a prototype is built, testing the lens over its intended temperature range is a must for two reasons:
- Verification of the thermal model
- Exposure of unanticipated failure modes
Thermal modeling in raytracing software is a powerful tool for minimizing temperature sensitivity, but the material models are highly idealized compared to real-world use cases. Real glass and metal are not homogenous, and one lot of 6061 aluminum may have thermal properties that differ slightly from published coefficients. Different materials conduct heat at different rates, making it hard to predict if and when a lens will reach an isothermal state. Germanium becomes opaque in the infrared at elevated temperatures. These are examples of intricacies that will not be accounted for in a sequential raytracing design process. In many cases it takes working with hardware to expose problems like these that can sink a design. Preferably this discovery should be made before the lens is in orbit!
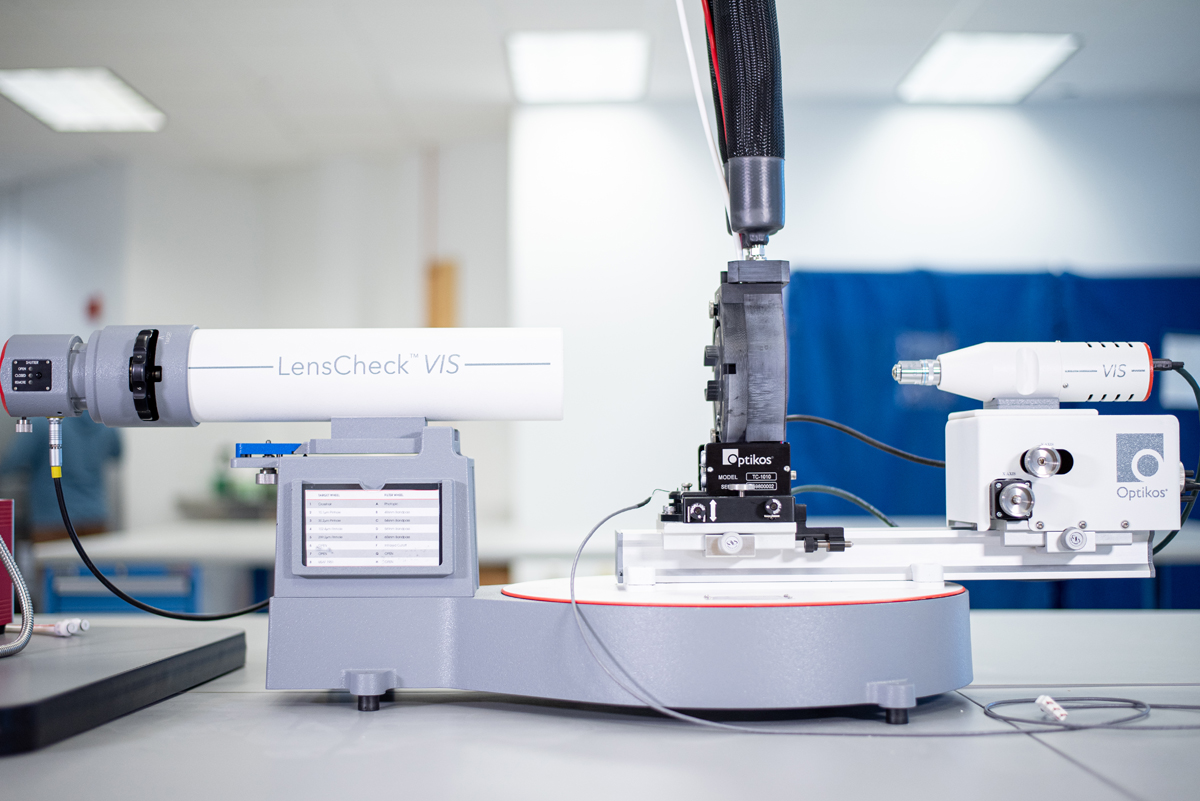
At Optikos, we are interested not only in these complex design challenges, but also in understanding how well our prototypes match our model predictions. For thermal characterization of lens assemblies, the OpTest® Thermal Module is an excellent metrology platform. In the data below, we used the OpTest Thermal Module to track the flange focal length of three lenses over a range of -10 to +60°C. Overlaid is a line representing the expected FFL shift with temperature as predicted by a thermal model built in Zemax OpticStudio. The slope of the model line is 0.6 µm/C.
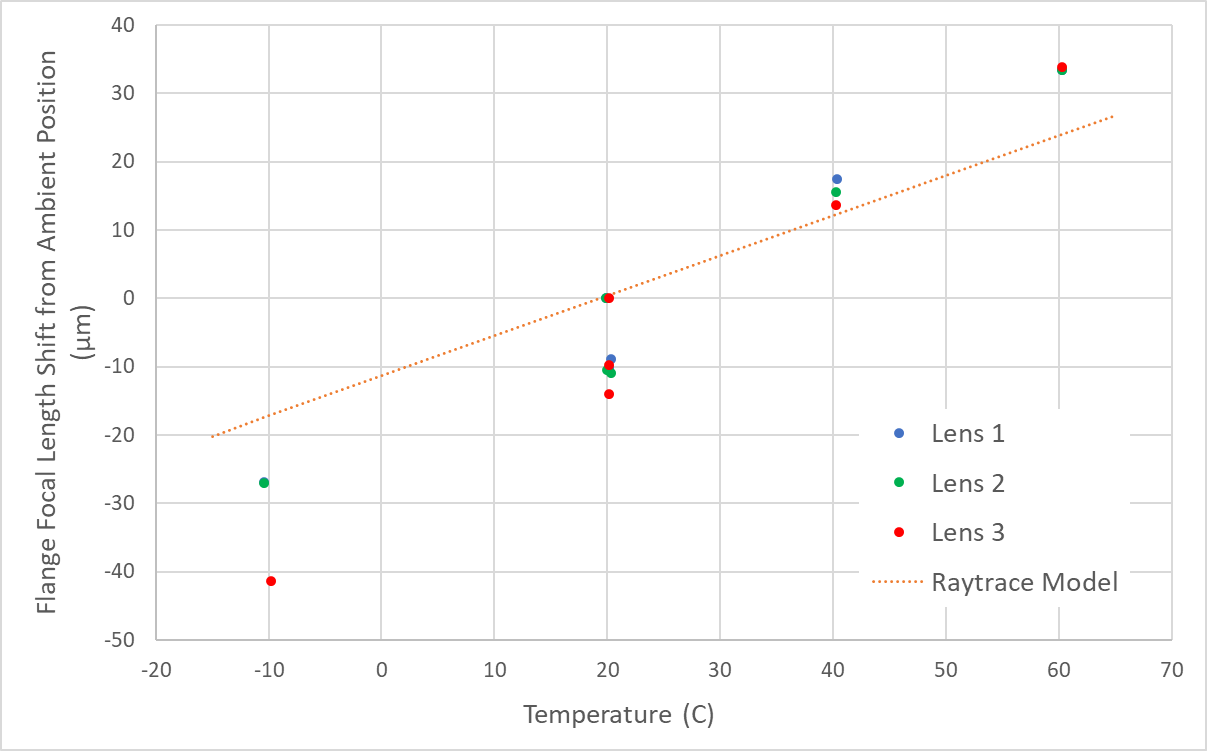
Lenses 1 and 2 both exceed the model by 50% at 0.88 µm/C. Lens 3 deviates further at 1.07 µm/C. Seasoned engineers will not be surprised by a discrepancy like this between modelled and as-built performance. The ability to quantify this difference and feed the data back into a future design iteration is key to achieving best-in-class athermalization.
If you inspected these measurements closely, you may have been confused by the data points at ambient temperature (20C). The reason there are three data points here has to do with the temperature cycle sequence. These measurements were not taken over a linear temperature ramp from cold to hot or vice versa. The lens was first measured at ambient, then heated for high temperature characterization, then cooled for cold temperature characterization, then heated back to ambient. Each of the three times the lens passed through ambient temperature, an FFL measurement was taken. So, FFL was characterized three times for each lens, with a 10µm disagreement between the measurements. What’s going on there?
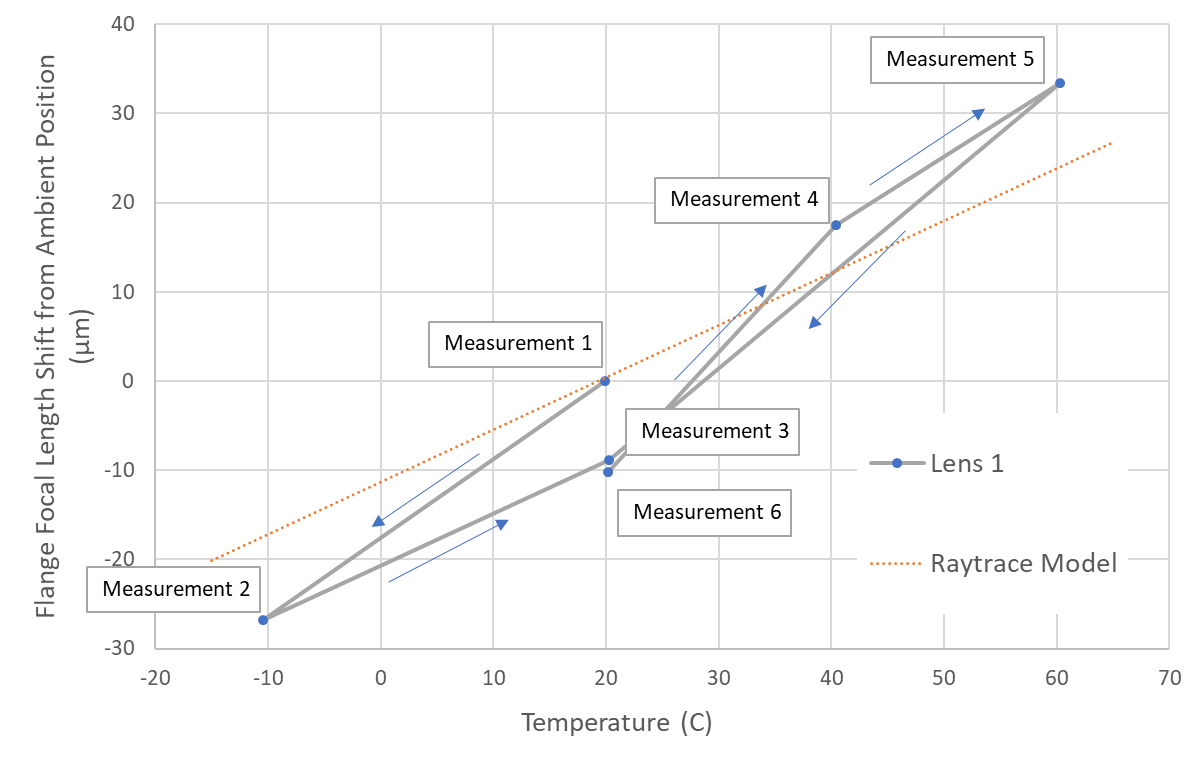
To probe this behavior further, the lenses were subjected to a few more temperature cycles, with the ambient FFL measured after each cycle.

The data becomes noticeably more spread after the super cold cycle down to 66C below ambient, but even so a pattern is apparent throughout this dataset: There are two consistent ΔFFL values, 0 and -10. When the lens approaches ambient from the hot side, the ΔFFL is 0. When ambient is approached from the cold side, it is -10. We have temperature-dependent hysteresis in our focal position.
The fact that this phenomenon is consistent across all lenses suggests that it is inherent to the design of the lens assembly, not a simple build error or material anomaly. Despite the root cause likely lying in the design, this is an unusual failure mode that a typical thermal model would not predict in the design phase.
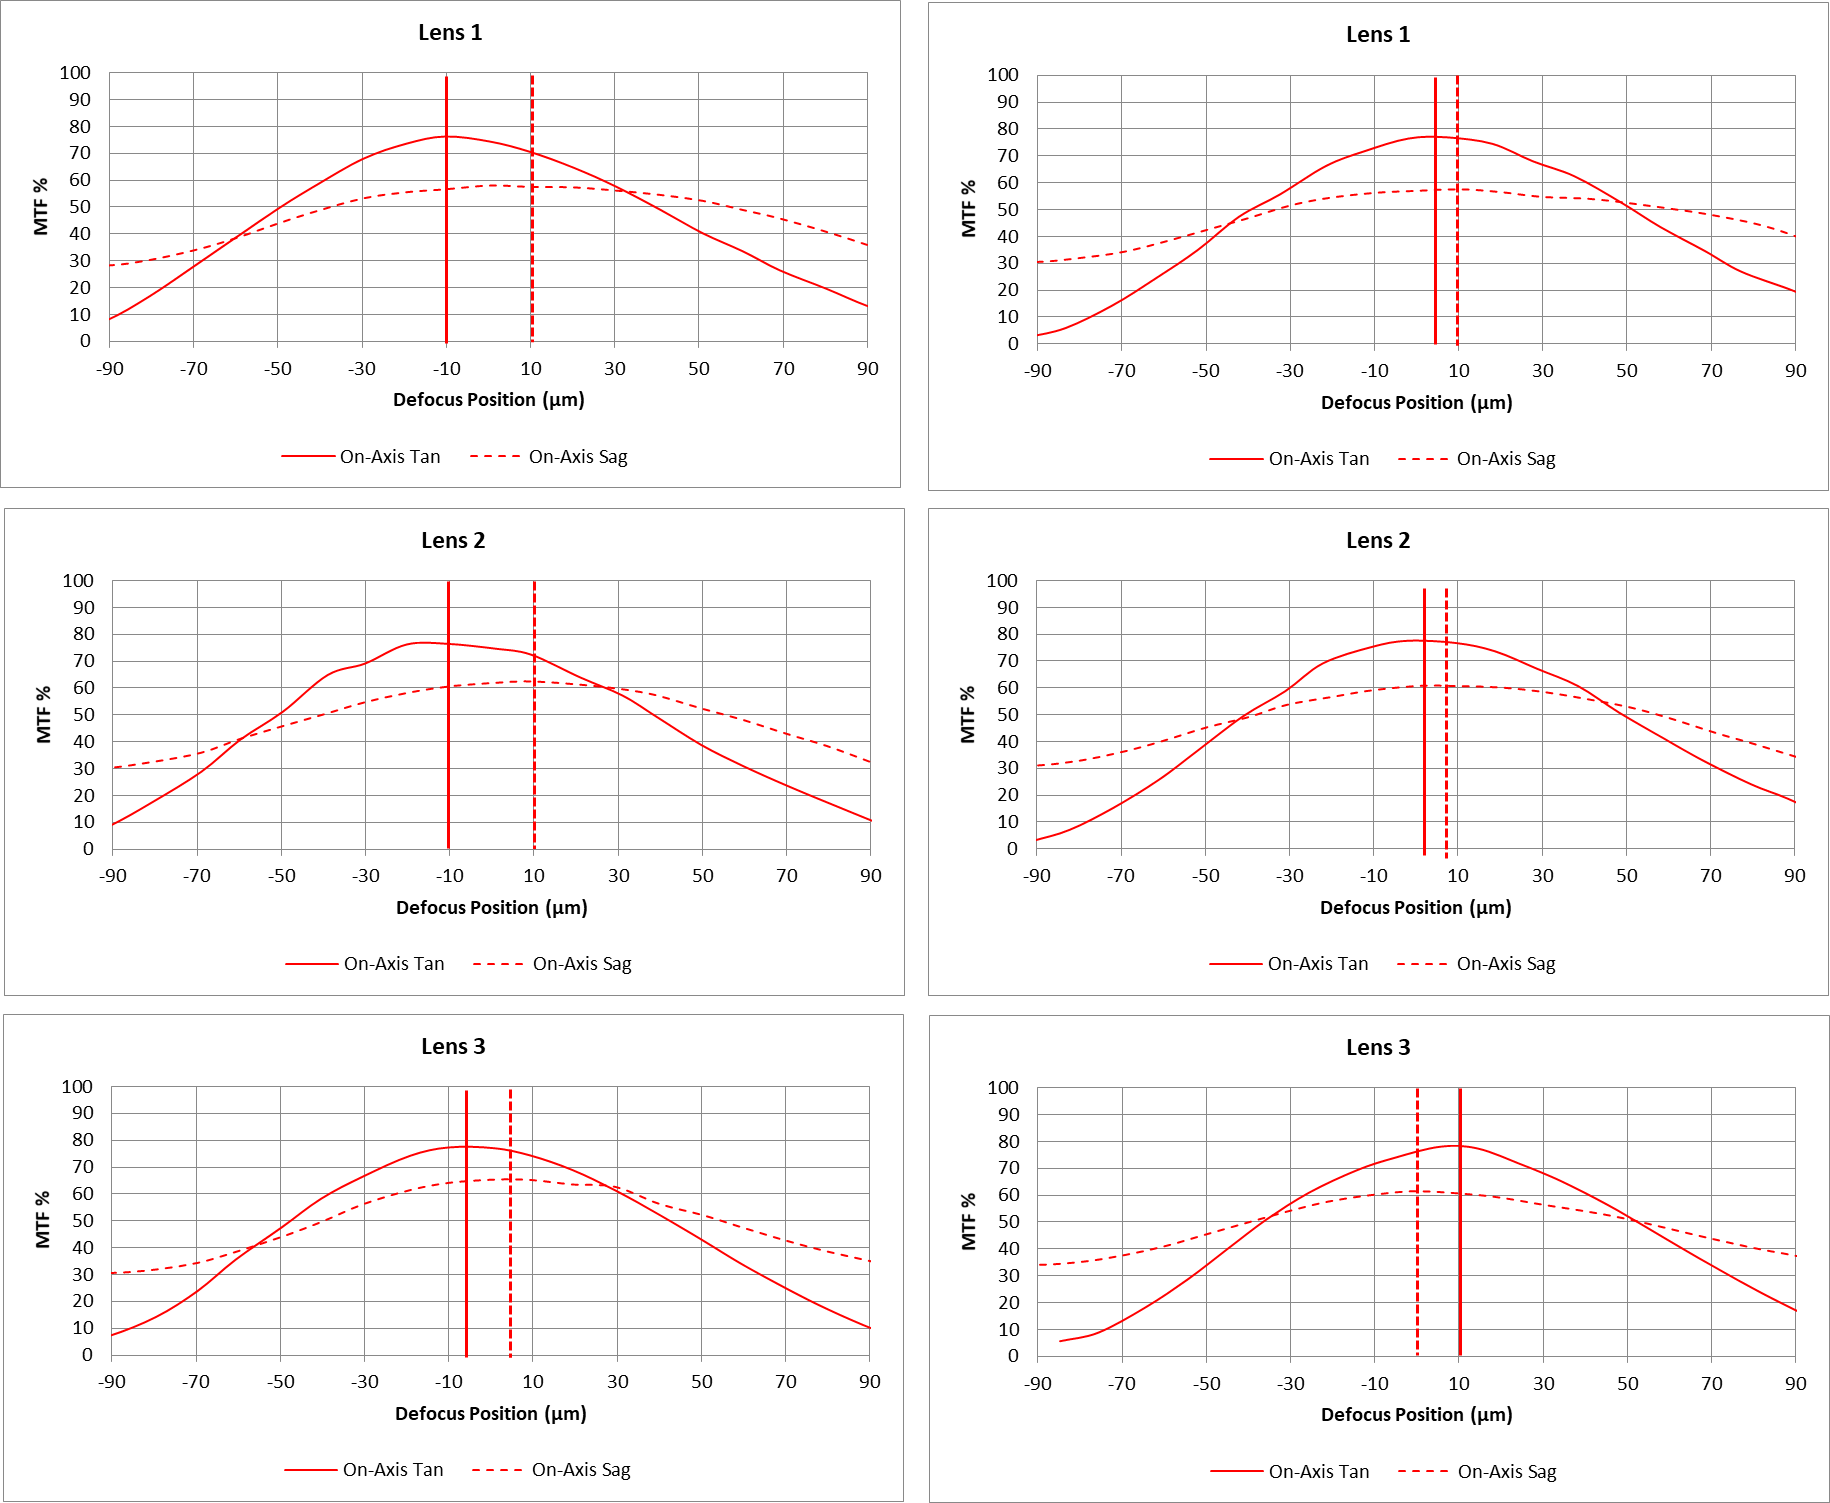
OpTest determines the best focus position by measuring MTF at a particular spatial frequency through a range of focus positions. This produces a pair of MTF vs Defocus Position curves—one for tangential, one for sagittal MTF—with a peak indicating the best focus position in each case. Astigmatism in the lens pushes the two peaks away from each other. The midpoint between these two peaks can be considered the “average” best focus, and an optimal location for a sensor behind the lens.
Digging into the through-focus MTF data reveals another clue about the root cause of the FFL hysteresis shown above. When ambient is approached from the hot side, there tends to be about 20µm of astigmatism in each lens. When ambient is approached from cold, the sagittal best focus plane shifts relative to the tangential plane by approximately 20µm. Lens 3 is the outlier here, where the shift doesn’t quite “correct” the astigmatism, but it does result in the sagittal plane flipping to the other side of the tangential plane. In both cases, this 20µm shift of the sagittal plane would result in the average best focus changing by half of that distance—potentially the same 10µm shift that we see when tracking FFL.
Astigmatism generally indicates non-rotationally symmetric errors in a lens assembly, which suggests that the hysteresis may stem from one or more elements in the lens decentering or tilting at some point during temperature cycles.
THF for Ambient Approached from Hot Side THF for Ambient Approached from Cold Side
Athermalization of multi-element lens assemblies can harbor challenges that are unlikely to be anticipated by the design team. When this is the case, the ability to identify and quantify shortcomings is crucial to fixing the problem. The dataset above highlights how some failure modes can be so subtle that they would be extremely difficult and time-consuming to diagnose without a state-of-the-art MTF bench, complete with appropriately precise stages, thermal control, and automated testing routines. This goes to show that athermal lenses are not immune to the old optical adage: “If you can’t measure it, you can’t make it.”
Share this Post
See More Posts

Blog
From Optics to Legislation, Optikos is Establishing the Standard for Thermal Camera Safety in Autonomous Vehicles
06/05/2026
•
6 min

Blog
That Extra Monte Carlo Tolerance Analysis Just Might Save Your Next Defense Project
05/12/2026
•
5 min
Blog
The OpTest® Bench: A Lens Metrology Multitool For The Defense Industry
05/07/2026
•
5 min