A key part of validating optical hardware is reconciling differences between design simulations and hardware test results. Understanding the subtleties of how simulation and test results are produced, and why differences may exist, can avoid potential frustrations and delays in the hardware testing process.
Many optical parameters such as effective focal length (EFL), distortion, and field curvature, can be simulated in a lens design by tracing the chief ray through the system and evaluating its location in the image plane. When measuring real optical systems, measuring these parameters requires evaluating a focused spot in the image plane. That spot is formed by a ray bundle that fills the system’s pupil. It is often impractical, or impossible, to restrict the optical path to only a paraxial ray bundle or a subset of rays that only pass through the center of the system pupil. This difference between model results using the chief ray, and measured data often evaluating a spot centroid, can lead to apparent differences between model and experimental results.
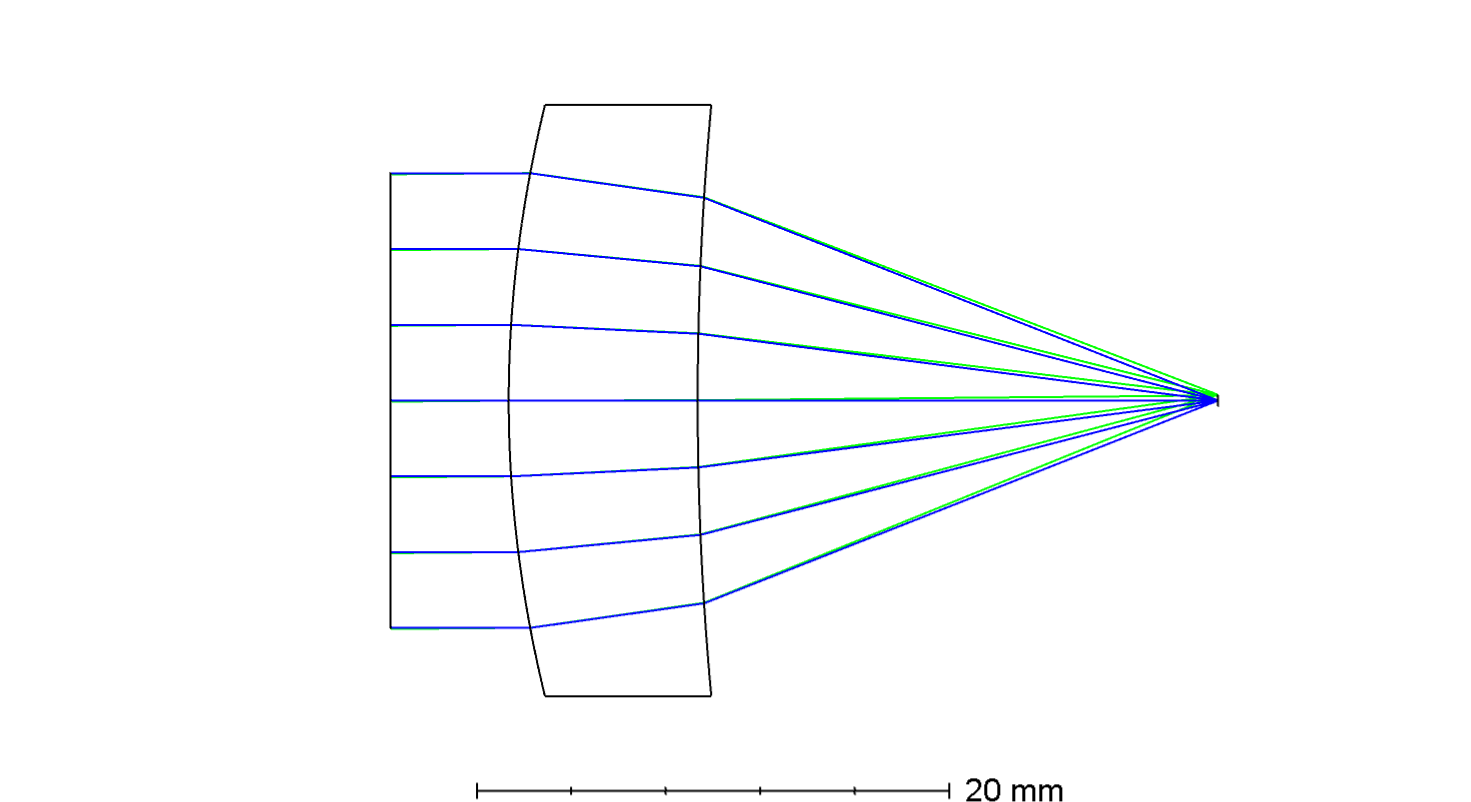
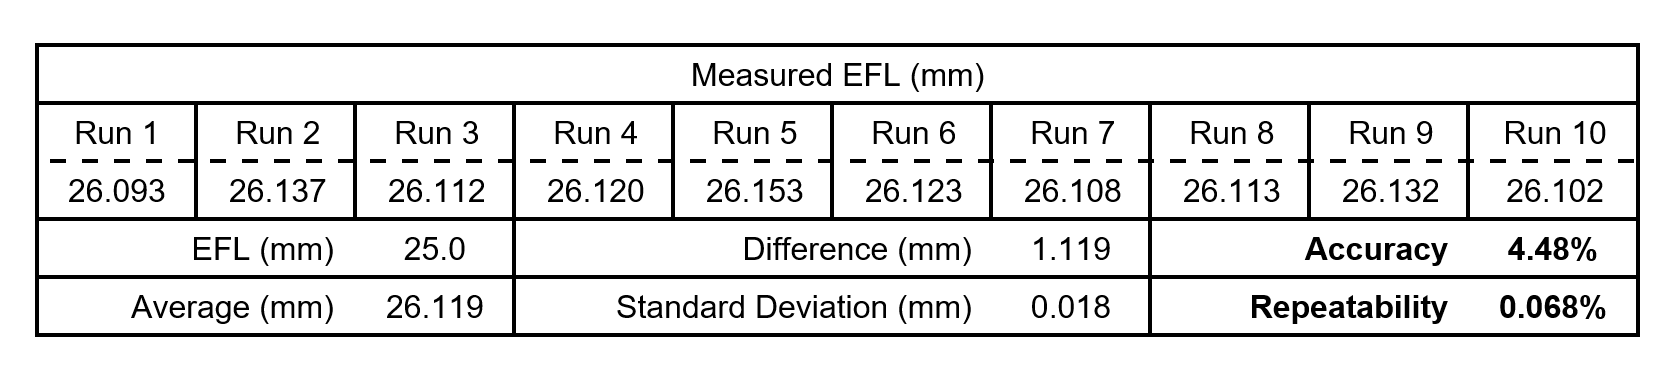
An example of this is highlighted in the measured EFL of a LWIR lens shown in Figure 1. The lens was designed with a 25mm EFL, but when measured it will consistently report a focal length of 26.12mm measured on a LWIR LensCheck™ system (Table 1).
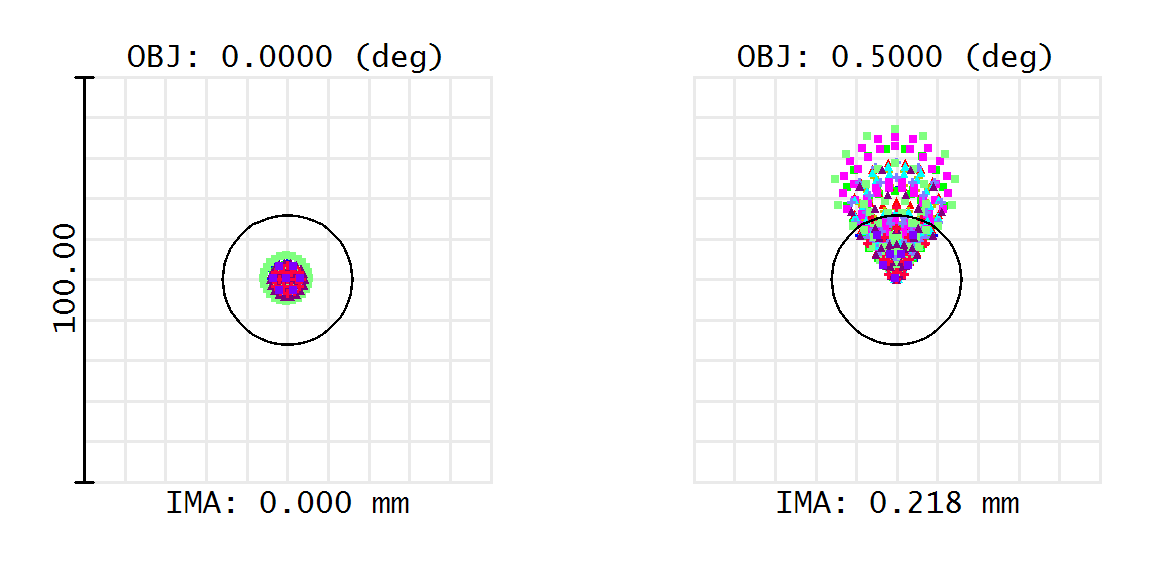
At first glance this appears to be a conflict between the test results and the model simulations. However, this difference can be readily explained when considering the spot centroid versus the chief ray location in the image. The shift from centroid to chief ray angle is visible in the spot diagrams shown in Figure 2. The significant coma in this lens results in a spot centroid that is not centered on the chief ray. This will cause a difference in the measured EFL compared to the reported EFL of the lens design software. The modeled EFL increases to 26.2mm when using the spot centroid instead of the chief ray. This value is much closer to the measured result.
While this example may be simple, it illustrates the value in understanding the principles of operation of your test instrumentation. This centroiding error could also impact distortion or field curvature measurements. Your optical test equipment can impact other measured values as well – for example, does the spectrum of the test bench light source match the modeled spectrum?
When you are seeking the most accurate test results there can be many factors that impact measurement accuracy. In these cases it is not enough to compare the raw output of your simulations to hardware tests. Optikos engineers have significant experience with simulating and testing optical systems. If you have an optics-related challenge you need help with, reach out to us.

