In the world of visible light sources, it’s hard to beat light emitting diodes (LEDs). These tiny emitters are mass produced in countless varieties of color and intensity, making them the obvious choice for a device that requires a lot of light at specific wavelengths. Often there are dozens of candidates that would produce acceptable performance. Some applications, however, push the envelope either by maximizing throughput, multiplexing via coexisting spectral channels, or coupling the light into finicky optical elements. In these cases, the LED can become a performance limiter, making it critical to select the best LED for the device.
Now we have a problem: LEDs are advertised primarily for the enormous market of general lighting. This use case has a simple problem statement: Illuminate something large and far away—A wall, some signage, or a room are some common examples. “Far away” is a relative term, but here we mean a distance much larger than the size scale of the LED emitting area, typically about one square millimeter. Because distant illumination is what manufacturers have in mind when writing technical data sheets, the quantities in these documents tend to describe the far field performance of the LED.
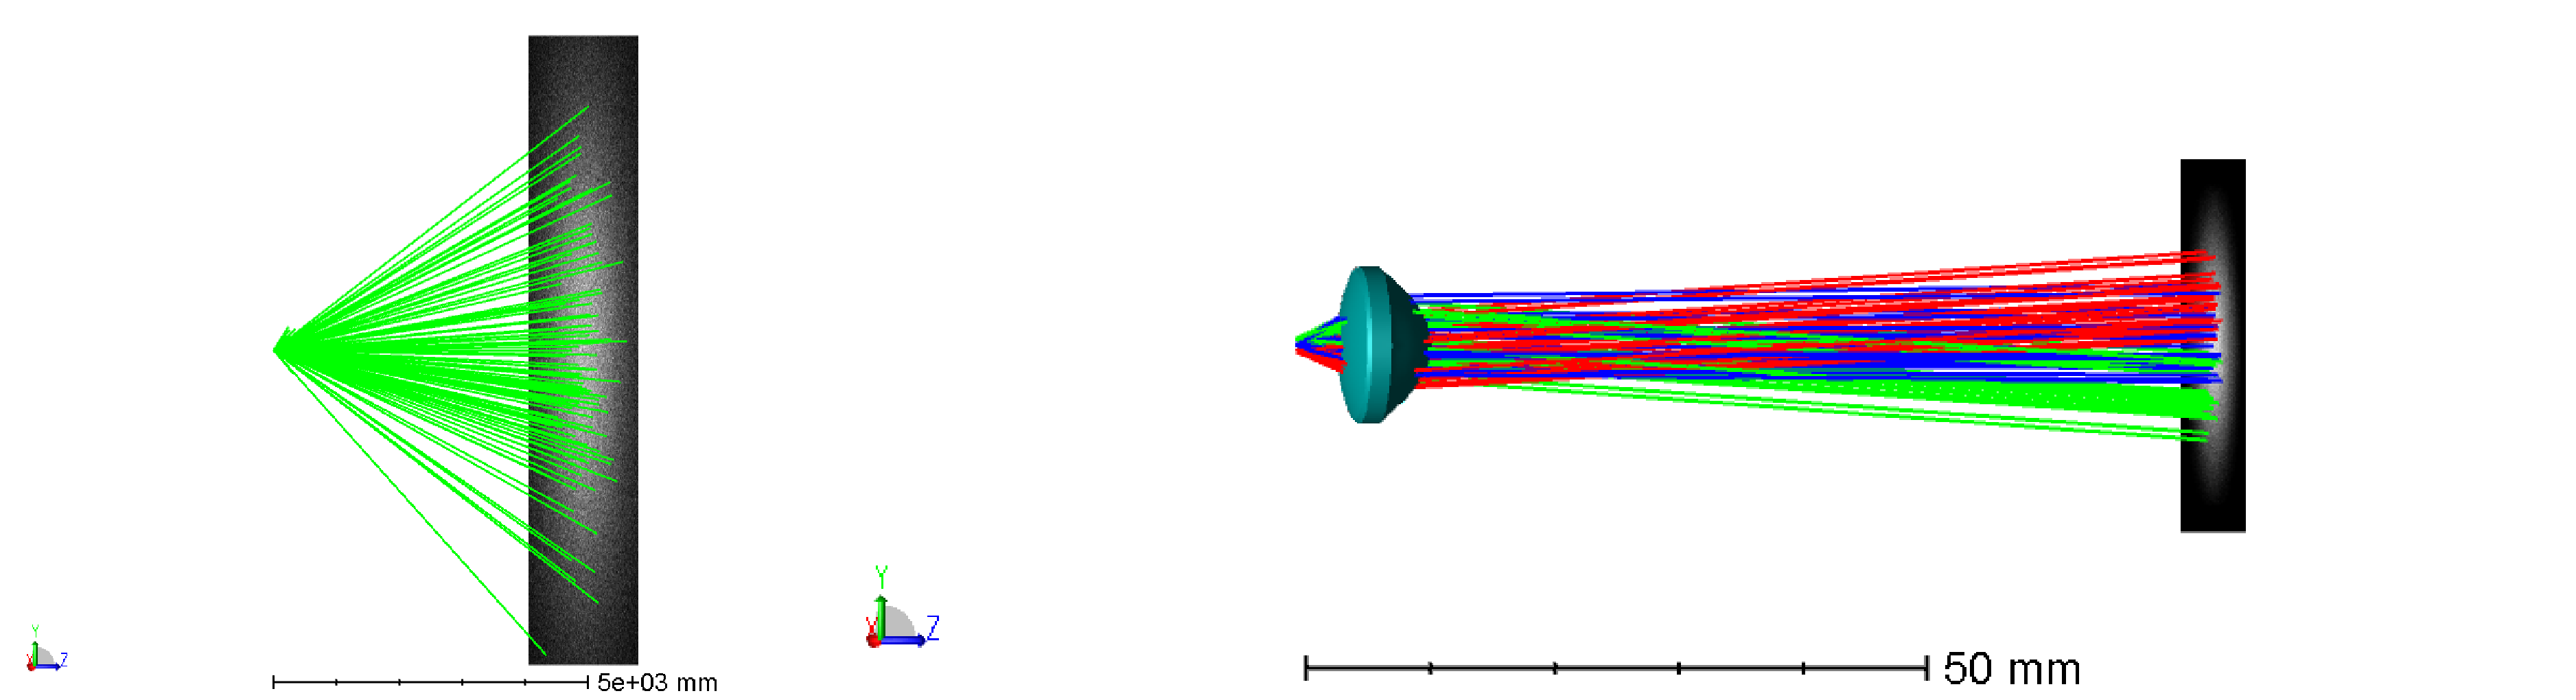
For instance, intensity may be listed in units of candelas, or the amount of light power that the LED emits into a certain direction. This is an angular quantity that describes the far field characteristics of the irradiation pattern, but in doing so it simplifies the structure of the LED as an apparent point source to the distant object. What if we want to collect the LED light with a nearby object, like a collimating lens or fiber optic waveguide, to deliver it to a sample? To predict how much light we’ll be able to collect, we also need to know the size of the emitting area. The product of the angular emission and the effective emitting area define what’s known as the étendue of the LED. This is an important quantity to consider when calculating how much of an LED’s advertised optical power will be conserved by the collecting optic. Beware of LEDs where brightness is reported in terms of lumens or milliwatts—often a brighter LED simply has a larger emitting area. If the device is already étendue-limited by a lens, the extra LED milliwatts will simply consume more power without delivering any additional light to the sample!
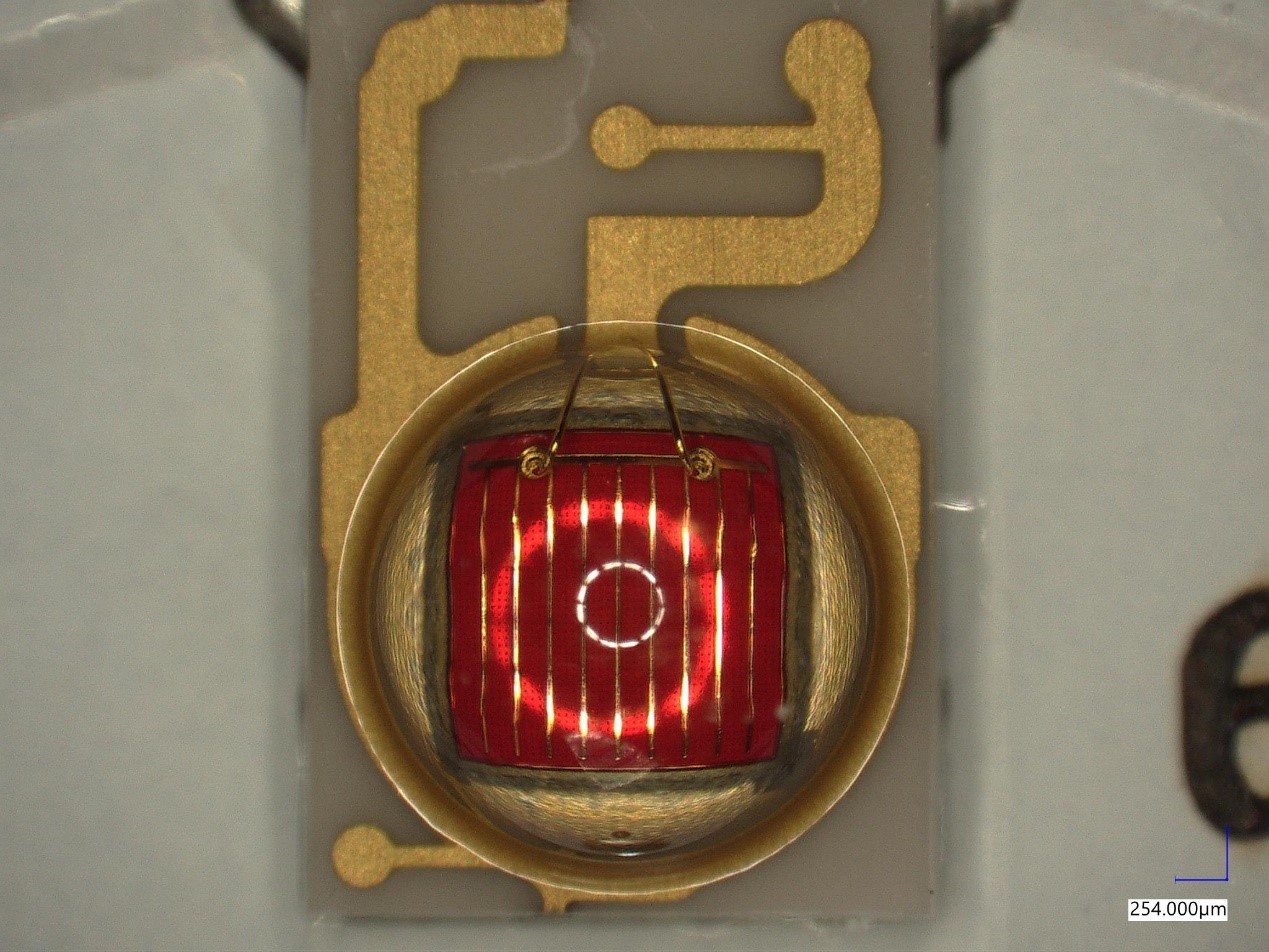
Sometimes to maximize optical power delivered to a sample, we relay an image of the LED onto the sample. If this approach is used, it’s also important to be aware of nonuniformity due to structures on the surface of the LED. These dead spots on the emitting surface will form regions of low optical power delivered to the sample.
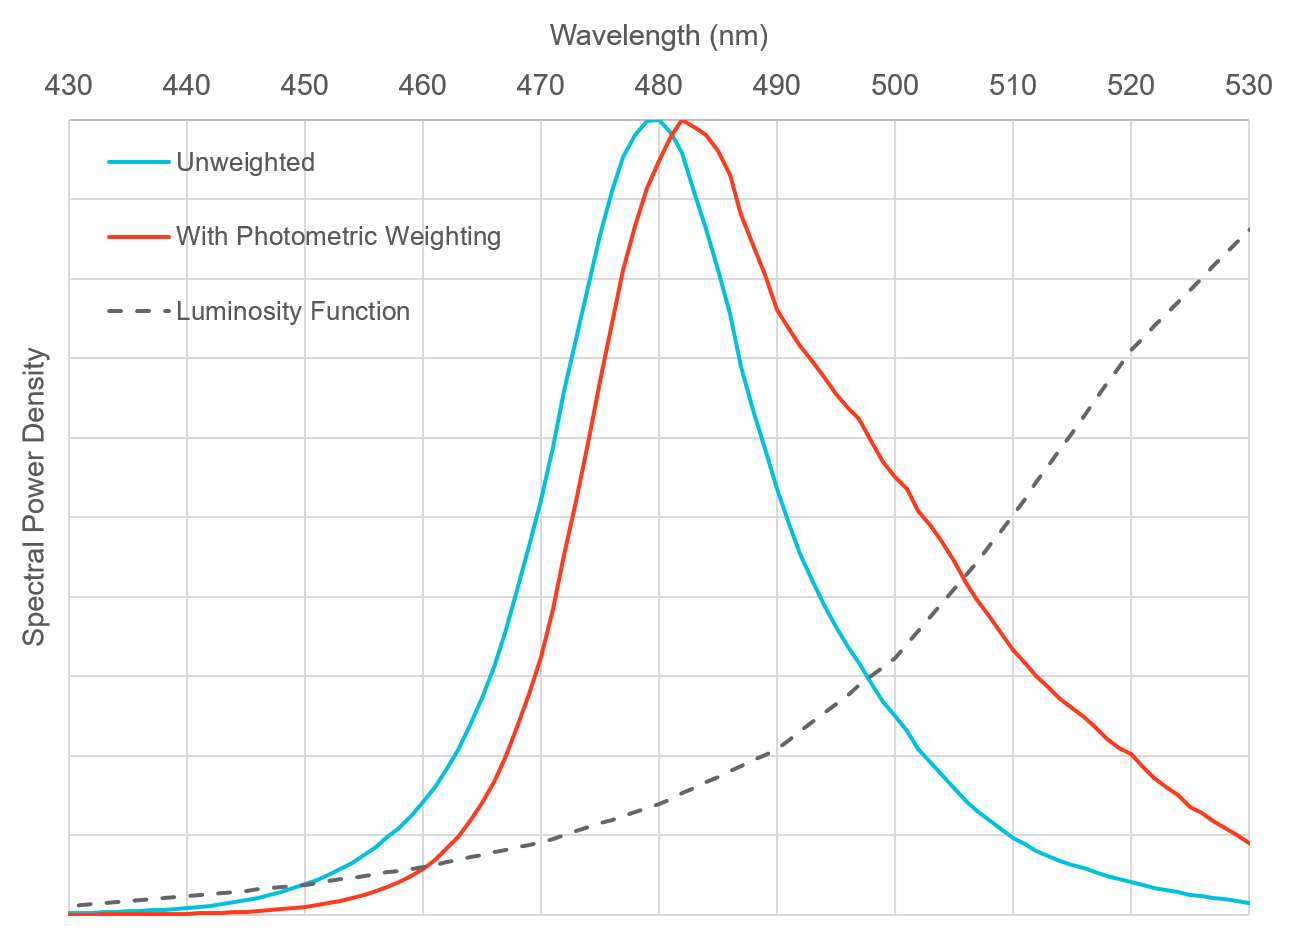
Another pitfall when selecting LEDs can be how their color is reported. Remembering that LEDs are advertised for lighting applications, their spectral output is commonly reported in terms of their Dominant Wavelength. Those who are unfamiliar with photometric units might not know that Dominant Wavelength is NOT the LED’s peak wavelength. Mathematically, it is proportional to the area under a curve resulting from the product of the LED’s spectral power distribution and the spectral responsivity of the human retina. Why the human retina? Because in general lighting, customers are interested in what color an LED will appear to be to observers, not what color it actually is. This is a small effect that might not be of any consequence, perhaps a couple of nanometers of disagreement between a blue LED’s dominant wavelength and its peak wavelength. But if being used with fluorescence emission filters with steep cut-ons at specific wavelengths, a couple of nanometers can be the difference between high contrast images and images saturated by background light leak.
These are a few scenarios where the implications of LED selection become more complicated than a simple review of data sheets can adequately predict. A great way to understand these effects is to build spreadsheets that perform the radiometric and spectral calculations that yield estimates of light delivered to a sample. Excel jockeys with high confidence in their understanding of the relevant optical physics might include more complicated processes like fluorescence or the resulting photoelectric current in a sensor. Nonsequential raytracing software can be a useful optimization tool as well. But these models are just that: Approximations and optimization tools. To gain confidence that the right selection was made and quantify in absolute terms the quality of data produced by a device, test with hardware early and often.
Some common questions that are best evaluated in hardware testing are:
- How uniformly is the sample illuminated?
- How much does the peak wavelength shift as the LED heats up?
- How accurate was the spectral curve you pulled from that low-res chart in the data sheet?
- Are you illuminating a fluorophore dye so intensely that the sample bleaches?
- Is stray light in the sample holder an issue?
- In a multiple spectral channel device, how much signal crosstalk is Channel A seeing from Channel B?
In quantitative devices, understanding LED effects can constitute the lion’s share of the product development phase. A firm grasp of optical principles and best practices can minimize the timeline necessary to answer these questions. That’s where we come in—contact us today if your team needs assistance from the Optical Engineering Experts.

