Optikos has engaged in multiple projects related to non-contact measurement of liquids. Typically, these measurements serve as a quality control (QC) step for an automated fluid handling process. Example projects include:
- Characterize turbidity (cloudiness) of bacterial samples to evaluate growth rates and populations prior to antibiotic testing
- Perform a critical, non-contact QC inspection of MRI contrast agents in a flow cell immediately prior to patient injection
- Perform QC check of concentration gradients in a centrifuge tube
A variety of optical techniques are available depending on the sample characteristics and the required measurement sensitivity. A major challenge for most non-contact measurements is the influence of the sample holder (test tube, cuvette, flow cell, etc.), particularly when the sample holder is of low optical quality. Below is a non-exhaustive review of possible measurement methods.
Note: all the methods below assume no fluorophore labels or other sample additives are permitted.
Absorption Spectroscopy:
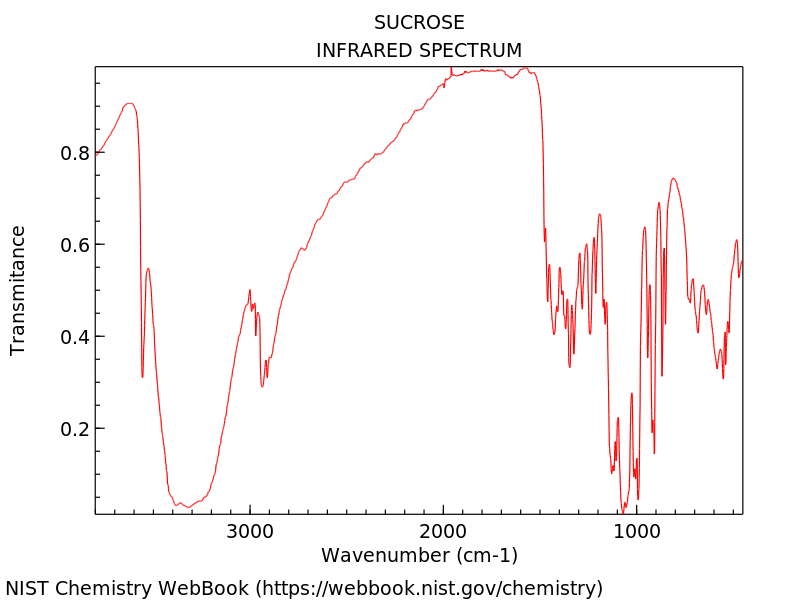
The well-known Beer-Lambert Law states that the concentration of a dissolved substance in solution is directly proportional to its absorptive capacity. However, the absorption of the dissolved substance is not usually constant with wavelength. Selecting the proper wavelength where the solute of interest is strongly absorbing is essential – this may be outside of the visible spectrum. The measurement is performed by illuminating the sample with the source and measuring the power transmitted through the sample.
Pros: Fairly insensitive to shape and quality of sample holder.
Cons: Need to know what the solute is and have an idea of its absorption spectrum. Low absorbance samples or low concentrations can be challenging.
Optical Polarimetry:
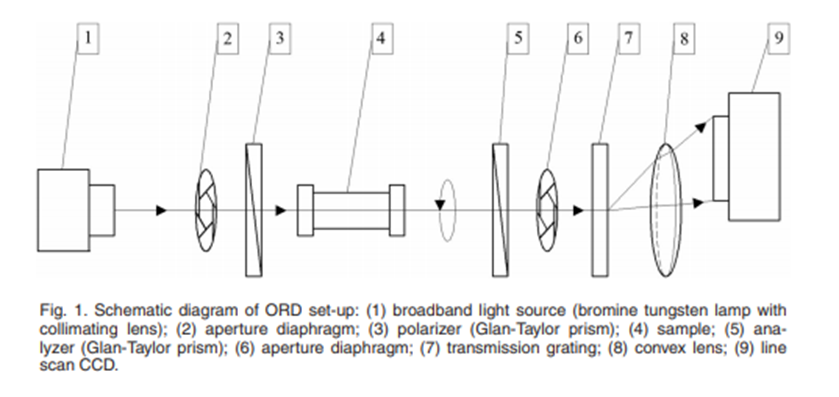
Optical polarimetry has been used for non-invasive measurements of glucose concentrations. It has been shown mathematically that optical rotation angle has a linear relation with concentration and distance traveled. The solute concentration can be deduced by illuminating the sample with light of a known linear polarization and measuring the polarization angle as it exits the sample.
Pros: Potential to detect very small changes in concentration.
Cons: Measurement will be disrupted by scatter, susceptible to quality of sample holder.
Raman Spectroscopy:
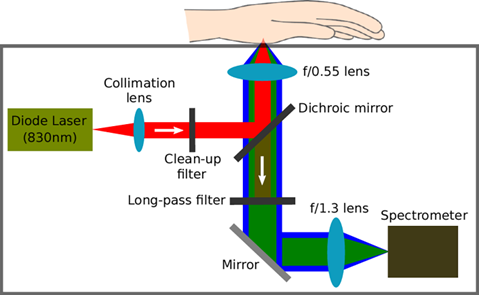
Another technique that has been used for non-invasive glucose concentration measurements is Raman spectroscopy. Raman spectroscopy works by illuminating a sample with a laser, which interacts with the sample and shifts the energy of the source. This inelastically scattered light is then detected, generating spectral data that can be used to determine the molecular pattern of the sample.
Pros: High chemical specificity, potential to detect very small changes in concentration.
Cons: Requires a highly sensitive and complicated detection system. Signal levels will be very low.
Quantification of Scattering:
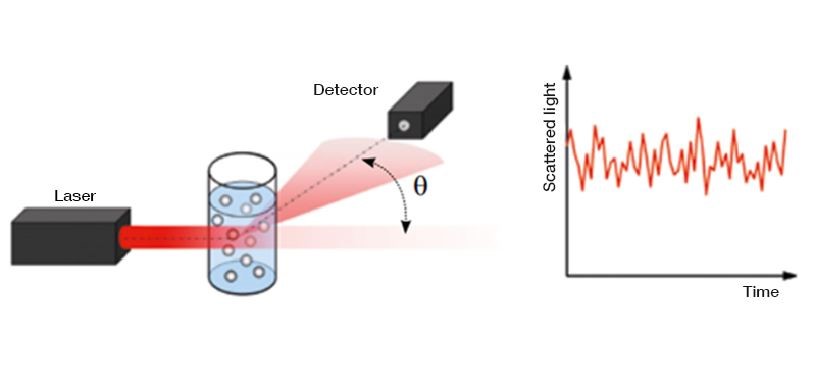
A method used for quantifying the turbidity (cloudiness) of commercial sugar solutions is directly measuring the amount of light scattered. This quantification requires making measurements at different scattering angles to characterize the scattering profile of the sample fully. This same method is leveraged for flow cytometry.
Pros: Relatively simple measurement to take.
Cons: Will be heavily impacted by the variability of the sample holder, not ideal for a fully dissolved solute, and challenging to separate from absorption.
Refractometry- Angle Deviation:
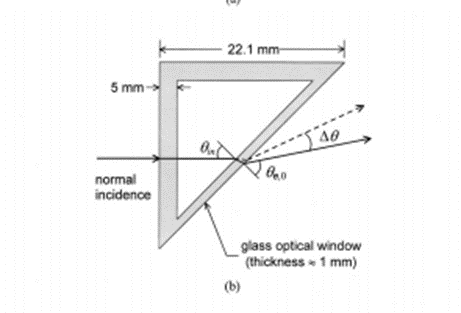
Snell’s Law tells us that given an angle of incidence and refractive index on both sides of an interface, we can predict the angle of refraction. Therefore, by changing the refractive index, we can change the angle of refraction. By measuring the angle of deviation of the source through the sample, we can quantify the change in refractive index, and therefore concentration.
Pros: Simple concept and metric to measure.
Cons: More difficult to implement with cylindrical sample holder, sensitive to misalignment and quality of sample holder.
Refractometry- Power on Detector:
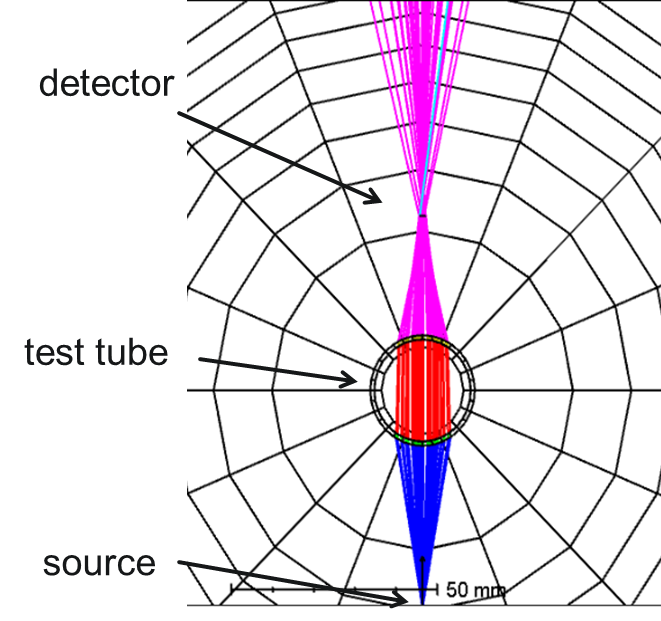
We can make another type of refractometry measurement by directing the light from a source through a test tube. The cylindrical sample holder acts as a lens in one plane, bringing the beam to a focus. With an increase in concentration/refractive index, the location of the focus will move closer to the sample holder. By placing a detector in the focal plane, a focal shift can be recorded as a change in recorded power, which can then be correlated to the concentration of the sample.
Pros: Low cost and conceptually simple, less sensitive to tube quality.
Cons: Geometry must be set up carefully to maximize the sensitivity of measurement.
Interferometry:
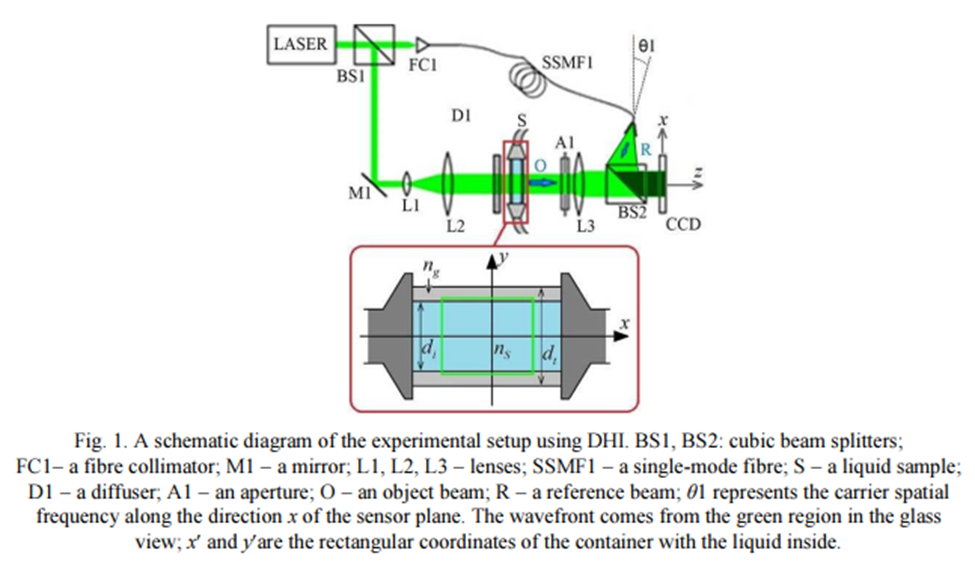
The principle of interferometry is gaining information from the interference of multiple waves, one that travels a reference path and one that travels through the sample of interest. The information obtained from the interference of these two paths- both phase and amplitude- is contained within a hologram. To measure sample concentration, two holograms are recorded. First, with the sample holder filled with a reference solution (water), and second, filled with the solution of unknown concentration. Differences in phase obtained from the correlation of the holograms provide information about the refractive index variation.
Pros: Can obtain a complete picture of the concentration across the spatial extent of the sample.
Cons: Requires taking a measurement of the sample holder before it is filled. Complex implementation.
Reflectance Measurement:
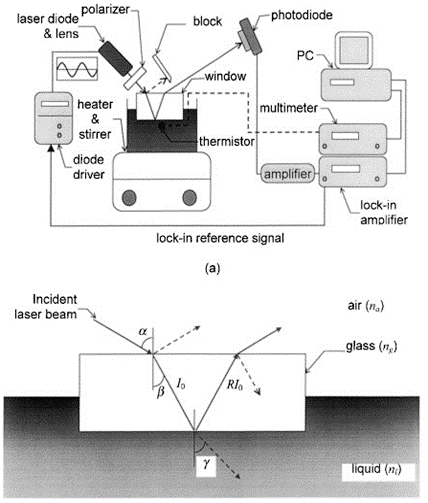
Another well-known optical principle is how the power reflected from an interface directly depends on the index of refraction of the two materials. A change in concentration, and therefore index, would correspond to a change in reflected power. By measuring the power reflected at the interface between the sample and the sample holder wall, the sample concentration can be determined.
Pros: Less sensitive to misalignment and sample holder quality.
Cons: Sensitivity may be too low, as a significant amount (often a majority) of reflected light is from the tube/air interface, which is constant regardless of concentration.
Return to Anywhere Light Goes blog.
Written by Lauren Scheg, Optikos Corporation
References
Fig 1. NIST Chemistry WebBook; https://webbook.nist.gov/chemistry
Fig 2. Y. Lei, H. Jia, X. Xu and S. Jiang, “An Optimized Drude’s Equation For Polarization Measurement in the Visible Region and Concentrations Estimation,” in IEEE Photonics Journal, vol. 10, no. 1, pp. 1-9, Feb. 2018, Art no. 6100209, doi: 10.1109/JPHOT.2017.2787576.
Fig 3. Lundsgaard-Nielsen SM, Pors A, Banke SO, Henriksen JE, Hepp DK, et al. (2018) Critical-depth Raman spectroscopy enables home-use non-invasive glucose monitoring. PLOS ONE 13(5): e0197134. https://doi.org/10.1371/journal.pone.0197134
Fig 4. Rieger CJ, Carpenter FG. Light Scattering by Commercial Sugar Solutions. J Res Natl Bur Stand A Phys Chem. 1959;63A(3):205-211. doi:10.6028/jres.063A.016
Fig 5. Krishna, V, C. H Fan, and J. P Longtin. “Real-Time Precision Concentration Measurement for Flowing Liquid Solutions.” Review of scientific instruments 71.10 (2000): 3864–3868.
Fig 7. Guerrero-Méndez, C., Saucedo-Anaya, T., Araiza-Esquivel, M., Balderas-Navarro, R., López-Martínez, A., & Olvera-Olvera, C. (2017). Measurements of concentration differences between liquid mixtures using digital holographic interferometry. Metrology and Measurement Systems, 24(1), 19-26. doi:http://dx.doi.org/10.1515/mms-2017-0002
Fig 8. C.H. Fan, J.P. Longtin, Laser-based measurement of liquid temperature or concentration at a solid–liquid interface, Experimental Thermal and Fluid Science, Volume 23, Issues 1–2, 2000, Pages 1-9, ISSN 0894-1777, https://doi.org/10.1016/S0894-1777(00)00019-4.

